@jwilling, I tried to reproduce your result and moved the creation part into a separate script. The increase still happens.
My config: FMS 18.0.3 on 2012 MacMini server 16GB 1TB SSD.


yeeesh, well now I gotta test again. Weird. I wonder if it's from that Exit Script[] in your subscript
What do you get now?

Took the exit script step off, still see increase.
Can you post the modified script, please?
Some changes that I have been trying on this end:
-
Updated data type of "Text" field to be type Text.
-
Removed any logging to a table.
-
Instead of capturing all metrics, I am simply capturing a delta for Go To Record, and one for the write section, and maintaining global variables to capture the max values for these delta over the course of the script.
-
Also capturing a metric for the time it takes to run all loop iterations collectively.
Failing to capture the individual deltas with each iteration means its easier to be thrown off by a single real bad spike, but I was lazy in setting this up (sorry), and I am also hoping that capturing the full script time would help temper this a bit.
Some variations that I have tried:
1) Just the changes mentioned above:
---- 100K records, no logging to table ----
Max write delta ms: 8020
Max next record delta ms: 8011
Full script s: 191.621
2) Commented out the write section:
---- 100K records, no logging to table, commented out write section per JWilling ----
Max write delta ms: 0
Max next record delta ms: 17
Full script s: 36.74
3) Removing the option for Table or List view from the Target layout:
---- 100K records, no logging to table, yes writes to Target, but with form view ----
Max write delta ms: 61
Max next record delta ms: 23
Full script s: 52.725
4) Factoring out the write section to a subscript:
---- 100K records, no logging to table, write steps factored to separate script per JWilling ----
Max write delta ms: 118
Max next record delta ms: 41
Full script s: 68.145
Note that all of the above tests are with running the file locally -- not using FMS.
I am going to run the above again in case I goofed something up, but I'll also include total value capture for the deltas -- not just the max values.
HTH,
-steve
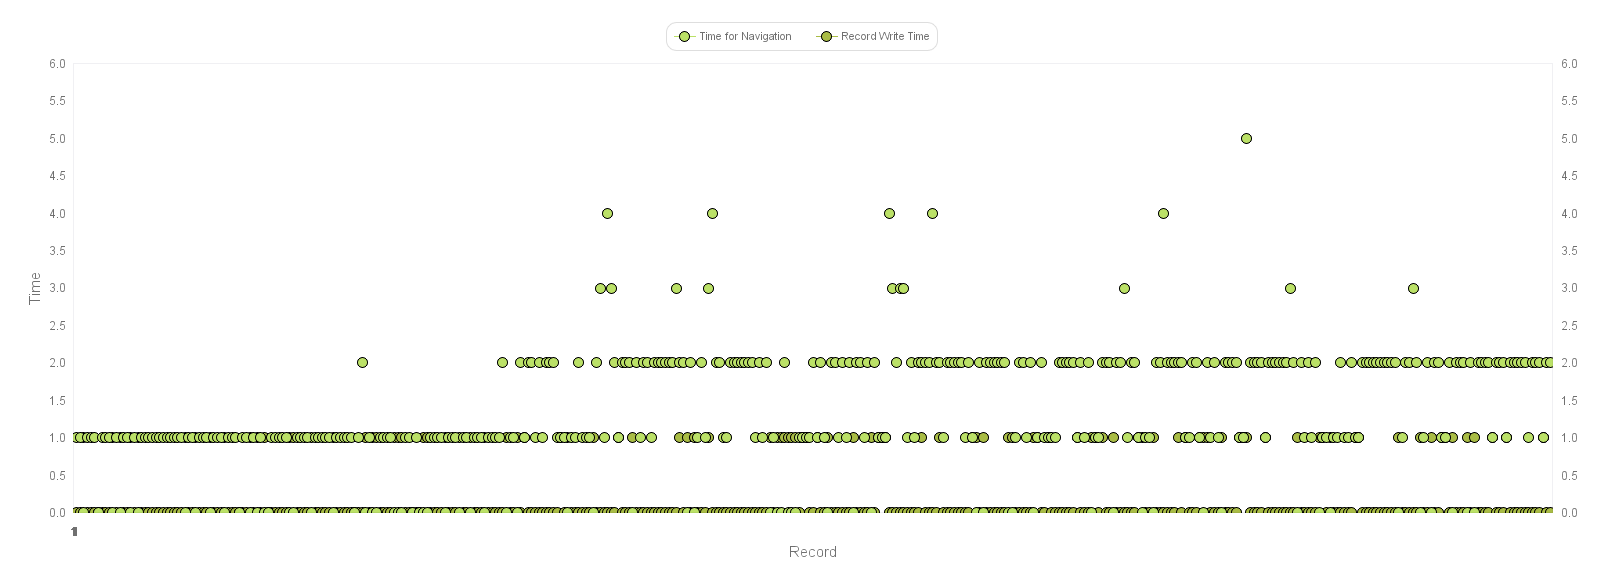
Having put some of the script into a subscript I'm still seeing a steady rise in processing time for the script. The graph looks identical to earlier ones. The main difference that I see is in the navigation and record write times. They are at increased levels. The increase occurs earlier and goes to higher levels.
LoopPerformance Clone.fmp12 (212 KB)
Here you go.
Excellent testing! I just switched off 'Quick find' in all concerned layouts and while there is still an increase, it speeds up things considerably. 
Conclusion for now:
'Quick find' enabled in conjunction with 'Go To Record' forces an update of the indexes, each time that script step is executed (@Cecile hinted at index update as a likely cause) . The increase in execution time does not go away but is less pronounced.

Its 1 a.m. now, gonna have a sleep.
Thank you all for chasing the thing with me!
Best regards
Torsten
There was discussion around whether switching layouts and/or record creation were responsible.
Creating a new record took 1ms or less for 99.8% of the actions over 7000 loops. These times were the same at the beginning and end of the loop.
Switching layouts took 1ms or less for 70% of the actions over 7000 loops. However, this action is affected by the size of the data sets. Switching layouts took 1ms or less over 99% of the time when there were less than 2700 records. Once the record count was over 2700 then only 50% were 1ms or less. Over 99% were 2ms or less. This shows that the effort required to load the data set has an influence. However, the increase in time required to switch data sets is still very flat and it only accounts for a 2ms increase.
There is clearly an increase in the time required to perform this task that is not explained by the creation of new records nor by the loading of data caused by switching layouts. This is best shown in the first 2700 records when the combined layout switch and record creation are 1ms or less. The "Time Next" chart shows a distinctive, stepped increase that does not correspond with record creation. Nor does it correspond with layout switching.


Thanks @Malcolm
@Torsten & All:
I believe it may be the step that sorts the records that is killing the performance.

I'd like to play around with this some more before making strong assertions, but if you haven't tried checking performance with this particular step disabled, I'd suggest giving it a go if you have it in you to experiment further.
If I can nicely illustrate this with my sample file, I'll tidy it up and share.
Kind regards,
-steve

Thank you for posting these stats.
I am still just working with just aggregate (sum, average, max) values for my metrics, so, though this behavior was implied by what I have been seeing, actually having a full dataset and a visualization to see is a great advantage.
I have been running a lot of variations and this is the only one that is really striking (the effect of the found set being sorted).
The other (much less striking) trend I have been seeing is that ensuring that the layouts start and remain in Form View at all times reduces the data write time by an appreciable amount. Along with this, I feel as though I've seen the "next record" aspect of the script take longer while in Form View, but even with this nuance, using still Form View seems faster.
Looking at the bigger picture for @Torsten's scenario, since the data appears to be coming from an ingested XML file, I am hopeful that the script could function properly without sorting the records, but instead just leaving them in creation order, which (I hope) could already be in the desired order. Failing that, I guess one could play around with different sort orders and see if that helps. I've tried a variation which uses Sort Records and un-checks the option to keep the records sorted, but that has fared no better than using Sort By Field.
-steve
Edit/Extra:
It just occurred to me that, if the setup for @Torsten's script does necessitate a specifically sorted found set, then this might be the sort of situation where @Malcolm's thought about chunking the data could come to the rescue.
@steve_ssh, @Malcolm,
the assertion is correct. The original scrip can run without the explicit sort. I just ran the original script with sorting commented out. It finished in merely three minutes, took hours before.
I never suspected the sort, which happens outside the loop.
It makes my task much easier. Thank you so much!
This outcome raises a concern:
in the specific sample we had, sorting is not a hard requirement since the order of creation can be used.
What happens, when sorting is mandatory?
I did a quick test with 'Sort', 'keep records in sorted order' unchecked. It runs faster than 'sort records by field' but still has an impact on performance.
Having to chose between sorting and bad performance would be unfortunate.
Hi @Torsten,
Yes -- indeed it raises that very concern. So funny -- I was just about to comment a bit further to say that I look forward to reading the thoughts of others on this.
And then, the forum showed me the following alert! ![]()

And so, with that perfectly timed prompt, I'd like to invite everyone over to share their points of view, too. ![]()
All the best & kind regards,
-steve
As the initial sort only takes a moment, it's easy to imagine an import, sort, export sorted, re-import routine.
Malcolm